

Executive Summary
As of late 2025, the top 10 stocks in the S&P 500 Index represented nearly 40% of market capitalization and almost half of total index risk, leaving passive investors heavily exposed to narrow leadership, sector dominance, and potential valuation reversals.
Although long-only active managers attempt to offset this concentration, structural constraints (particularly the inability to short) limit their effective breadth and weaken their ability to translate investment skill into portfolio outcomes.
A 130/30 strategy seeks to address these constraints by allowing managers to short unattractive securities while maintaining full market exposure. This flexibility enables managers to express both positive and negative views more fully, reallocate risk away from dominant benchmark constituents, and improve implementation efficiency.
By enhancing the transfer coefficient and expanding usable breadth, 130/30 strategies may provide a disciplined, benchmark-relative framework for mitigating concentration risk and improving risk-adjusted return potential in today’s highly concentrated markets.
Introduction
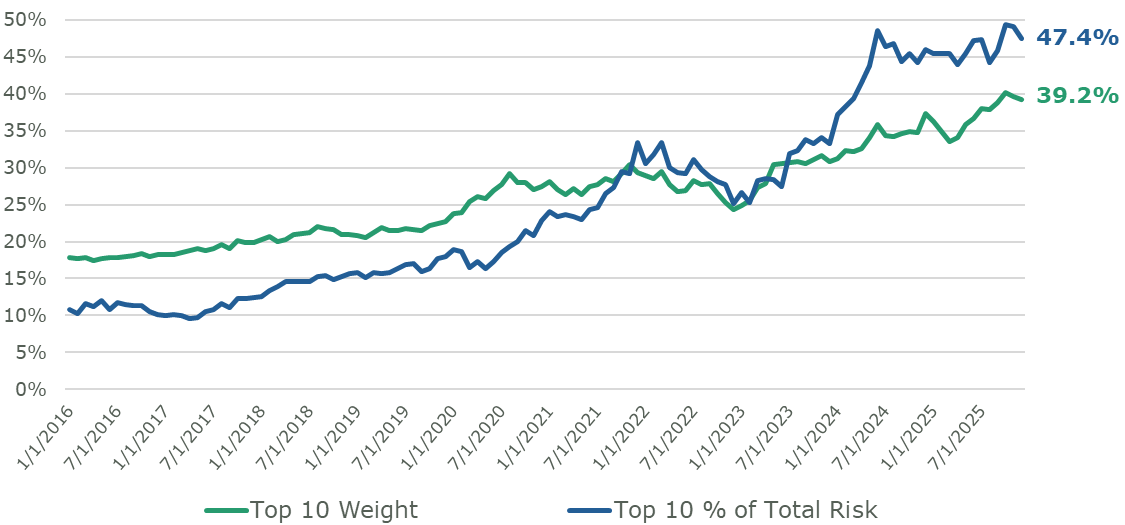
Passive equity investing has become the dominant implementation choice for many investors, largely due to its low cost and transparency. However, U.S. and global equity benchmarks have grown markedly more concentrated in recent years. As of late 2025, the top 10 stocks in the S&P 500 Index account for nearly 40% of the index’s market capitalization and drive about a 47% share of total risk, largely driven by mega-cap technology and AI-related names (Figure 1). This narrow leadership exposes passive investors to amplified risks from a handful of companies, sectors, and themes, heightening vulnerability to idiosyncratic shocks or abrupt sentiment shifts in these dominant stocks.
Figure 1:
Sum of top 10 stocks by market capitalization in the S&P 500 Index
10 years as of December 31, 2025. The 10 largest stocks account for nearly 40% of market weight and explain nearly half of total risk.
Traditional long-only active management seeks to counter this concentration through security selection that deviates from benchmark weights. However, structural constraints, especially the prohibition on short selling, severely limit managers’ ability to express negative views fully and diversify active risk.
Negative forecasts on overvalued or dominant stocks translate only into modest underweights or exclusions which constrains effective breadth (the usable number of independent active decisions implemented) and depresses the transfer coefficient (implementation efficiency, which is the correlation between optimal unconstrained weights and actual positions). These limits cap the realized information ratio and leave portfolios unable to meaningfully offset benchmark concentration without excessive tracking error.
A 130/30 mandate provides a compelling solution. This structure expands the opportunity set while preserving benchmark-relative discipline by permitting short positions (typically up to 30% of portfolio value) alongside 130% long exposure while still maintaining ~100% net market exposure. It enables fuller expression of positive and negative views, which may increase the transfer coefficient and enhance the impact of existing breadth. Managers aggressively short or underweight unattractive names and reallocate to high-conviction longs which may mitigate concentration risk more effectively and may enhance the potential for improved risk-adjusted active returns with controlled tracking error.
This paper examines these dynamics, showing how 130/30 strategies may address certain structural limitations of passive indexing and long-only active management in today’s concentrated markets.
Concentration Risk in Passive Indices
Capitalization-weighted indices mirror market structure rather than actively manage risk. As leadership narrows, they allocate more capital to the largest, highest-valued stocks. In recent years, mega-cap names have claimed a historically large share of major benchmarks, elevating their contribution to total risk and exposure to common factors, sectors, and valuation risks.
Higher concentration erodes the diversification benefits of broad equity indices. Portfolio risk increasingly depends on a limited number of securities which makes index outcomes more sensitive to company-specific events. While concentration can endure for extended periods, history reveals that highly-concentrated markets face greater vulnerability to regime shifts, leadership changes, and valuation normalization (see, for example, CFA Institute research on market concentration).
Passive investors cannot escape these dynamics. Benchmark construction embeds concentration risk, but mitigation requires active deviation from index weights. Consequently, passive portfolios risk sharper drawdowns or prolonged underperformance during leadership transitions.
Figure 2 illustrates this by comparing S&P 500 Index performance to an equal-weighted split of the largest and smallest stocks by market capitalization (annual rebalance). Since 2016, the top 50% by market cap has outperformed the cap-weighted index, reflecting mega-cap dominance in the post-2010s bull market.
Extending the timeline backwards to the year 2000 shows the reverse: broader or smaller-cap approaches often excel during mean reversion and rotation. This regime dependence underscores the persistent risk of indefinite overexposure to a narrow group of large stocks.
Figure 2:
Cumulative relative returns by top/bottom 50% by market capitalization vs. S&P 500 Index (annual rebalance)
As of December 31, 2025. Circles represent the annual number of names in the top 50%.


Structural Constraints of Long-Only Active Management
Long-only active strategies pursue benchmark outperformance through security selection and portfolio construction, yet index weights constrain them tightly. Managers freely overweight attractive stocks to express positive views, but negative views receive only modest underweights or exclusions.
This asymmetry severely restricts effective breadth and the usable number of independent active decisions implemented, especially in concentrated indices where narrow leadership hinders meaningful diversification. In practice, weak or negative forecasts often exert minimal impact (tiny positions or zero weight) and cause reduced active bets and lowered implementation efficiency, even with forecasts across a broad universe.
Risk-adjusted active returns depend heavily on breadth (number of independent investment decisions). Limited breadth hinders skilled managers from converting insights into consistent excess returns. In concentrated benchmarks, this intensifies as dominant securities drive most risk and compel managers to hug the index for tracking error control.
The transfer coefficient quantifies how efficiently managers translate active forecasts (alphas/signals) into portfolio weights. The long-only constraint, especially paired with no short-selling, imposes the largest drag, preventing meaningful underweighting/short positions on overvalued stocks in concentrated indices. This may cause distorted positions, lowered alpha-weight correlation, and reduced realized IR versus theoretical potential.
Negative views become passive (zero/minimal holdings) which is inefficient in benchmarks with long tails of smaller/overvalued names. Empirical studies confirm the long-only constraint typically reduces the transfer coefficient to 0.3–0.8, depending on universe and constraints (see Clarke, de Silva, and Thorley, 2002).
A low transfer coefficient ensures less skill (IC) reaches the portfolio, heightening concentration risk despite tracking error control. 130/30 strategies appeal because they may increase the transfer coefficient, may improve implementation efficiency, and may allow better realization of existing breadth and skill without expanding breadth itself.
The Fundamental Law and Transfer Coefficient
The information ratio (IR), a key measure of risk-adjusted active return, approximates IR ≈ IC × √Breadth × TC, where:
- IC = information coefficient (skill in forecasting returns)
- Breadth = number of independent bets
- TC = transfer coefficient (implementation efficiency, which is the correlation between optimal unconstrained active weights and actual implemented weights)
TC ranges from 0 to 1 in practice:
- TC = 1 → No constraints; forecasts fully reflect in positions (unconstrained ideal)
- TC < 1 → Constraints (e.g., no short-selling) distort positions, reducing skill flow-through
Lower TC and constrained breadth yield modest IRs, even with high IC, as constraints prevent full insight realization.
The 130/30 Framework: Enhancing Implementation Efficiency
A 130/30 strategy relaxes the long-only constraint by permitting short positions up to 30% of portfolio value while holding 130% long exposure and yields ~100% net market exposure. This both maintains benchmark-relative investing and empowers fuller expressions of positive and negative views.
Short positions allow aggressive underweighting of unattractive securities and redirection of capital to higher-conviction longs. Portfolios reduce concentration risk by trimming dominant benchmark names and spreading active risk across more securities. Alignment with the benchmark persists, yet performance depends less upon narrow leadership.
Table 1:
Comparison of Strategies
| Strategy | Breadth Level | Tracking Error Impact | Concentration Risk Mitigation | Alpha Potential |
|---|---|---|---|---|
| Passive Indexing | Low | Minimal | Poor (inherits index concentration) | None |
| Long-Only Active | Medium (constrained) | Moderate | Limited (constrained underweighting) | Moderate |
| 130/30 Active | High effective | Moderate | Strong (shorts enable diversification) | High |
This enhanced implementation (without an increase in raw breadth) proves essential for mitigating concentration risk. Long-only constraints limit effective, or usable, breadth by restricting the expression of negative views and forcing positive views to compete for finite capital, thereby reducing the transfer coefficient and the efficiency of active risk strategies.
By removing the long-only barrier, 130/30 structures may increase the transfer coefficient and may enable managers to implement a larger share of independent insights by improving effective breadth without proportionally raising tracking error. Empirical evidence suggests that under certain assumptions and implementations, extensions such as a 130/30 structure have been associated with higher transfer coefficients relative to long-only equivalents and may allow for more complete utilization of existing breadth and skill.[1]
Alpha Distributions, Breadth, and the Limits of Long-Only Implementation
Figure 3 shows the distribution of alpha forecasts in the Russell 1000 Index as of December 31, 2025. The chart highlights a key long-only limitation in cap-weighted benchmarks: negative views cannot fully express when benchmark weights are small. Many mid- to small-cap constituents carry negligible weights, which limits the ability to underweight or exclude securities expected to underperform. Strong negative forecasts enter only partially, or not at all, and materially reduce effective breadth and the transfer coefficient by distorting forecast translation into positions.
Figure 3:
Distribution of alpha scores in the Russell 1000 Index
As of December 31, 2025. Long-only constraints truncate negative-view implementation, constraining effective breadth and transfer coefficient, even with high conviction.

Figure 4 examines alpha forecast extremity relative to benchmark weights. The highest-conviction signals concentrate in smaller-cap segments. Long-only managers risk unintended size or factor exposures when fully expressing positive views, while negative expressions remain limited by small benchmark weights. This asymmetry wastes potential effective breadth and depresses the transfer coefficient, hindering efficient active risk allocation across independent insights.
Figure 4:
Alpha forecast extremity by market weight
As of December 31, 2025. Informative signals concentrate in smaller caps, where long-only limits reduce effective breadth and transfer coefficient. 130/30 may enhance both by enabling fuller active-view implementation.

A 130/30 framework seeks to address these issues. Short positions aggressively express negatives on smaller-cap/overvalued stocks which frees risk budget/capital for high-conviction positives without outsized tilts. This may increase the transfer coefficient for more complete skill (IC) realization and may enhance the impact of existing breadth. The outcome may include improved IRs through more efficient implementation, stronger concentration mitigation, and resilient active returns without excessive tracking error.
Conclusion
In an era of record index concentration, with the top 10 S&P 500 Index stocks commanding nearly 40% of market capitalization as of late 2025, passive strategies inherit amplified risks from narrow leadership, sector dominance, and AI mega-cap themes. Long-only active management, intended as a diversification counterweight, falls short due to constraints that limit effective, or usable, breadth and depress the transfer coefficient. This may hinder full negative-view expression and risk reallocation from dominant names without breaching tracking error limits.
The 130/30 mandate emerges as a compelling alternative for certain investors. By relaxing the long-only constraint with limited shorts, 130/30 structures may improve the transfer coefficient relative to long-only approaches, depending on portfolio construction and implementation. This enhanced implementation efficiency may produce portfolios that effectively mitigate concentration risk, diversify active exposures, and enhance the potential for improved risk-adjusted returns, while maintaining benchmark-relative discipline and controlled tracking error.
As markets evolve through 2026 and beyond – with persistent AI momentum, potential broadening, and ongoing concentration concerns – we believe 130/30 strategies may provide a disciplined framework to blend active insight with risk management considerations. Investors navigating how to manage a market environment with elevated benchmark risks (without forsaking indexing benefits or embracing more volatility) may find this approach increasingly essential for sustainable outcomes.
About Intech
Intech is a global quantitative asset manager that applies advanced mathematics and systematic portfolio rebalancing to harness a reliable source of excess returns and a key to risk control – stock price volatility. Intech applies its investment approach across five investment platforms which differ by risk-return objective: relative or absolute. Intech also integrates fundamental-based information to identify stocks with favorable underlying characteristics, complementing its volatility-based models that target stocks with attractive trading profit potential due to their volatility characteristics. These strategies only differ by the client’s desired benchmark and risk budget and include enhanced equity, active equity, defensive equity, extension equity, and absolute return investment solutions within the U.S., global, and non-U.S. regions.