
Executive Summary
Distinct Style Rotation: Large-cap growth underperformed while value and small-cap indices provided a critical buffer and marked a sharp retreat from mega-cap concentration.
Mega-Cap Reversal: The bottom half of S&P 500 Index stocks outperformed the top half which represented one of the most significant reversals of “Magnificent Seven” dominance in a decade.
Flight to Quality: Geopolitical events drove systemic moves into Dividend Yield and Investment Quality factors. Additionally, Momentum pivoted to favor these same defensive characteristics.
Margin Pressure: Rising oil prices and U.S. Treasury yields created a drag on Profitability and Growth factors as input costs and discount rates climbed.
Resilient Outlook: Despite “higher-for-longer” risks, a strong U.S. economy and potential near-term de-escalation in the Middle East could spark a broad rally as the “uncertainty premium” evaporates.
Performance Review
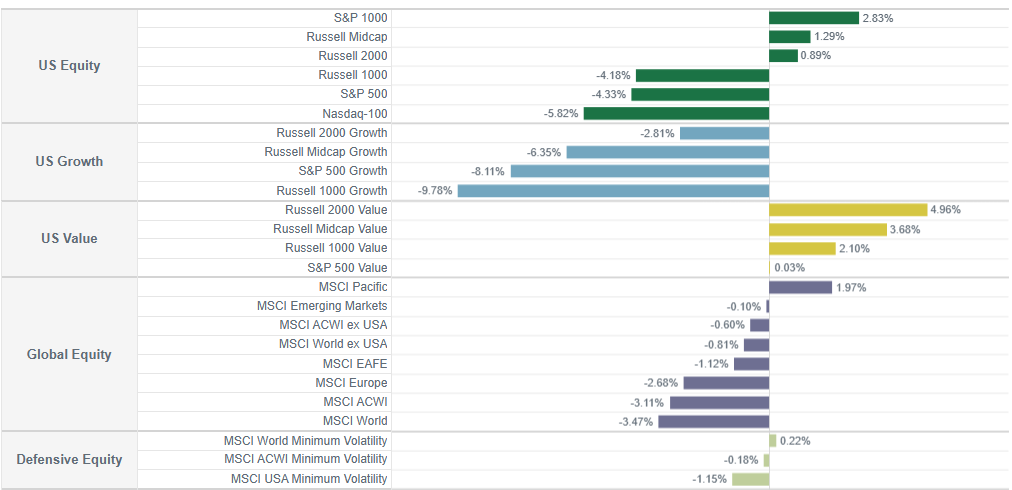
U.S. large-cap indices led market declines during the first quarter of 2026 as late-quarter geopolitical escalations accelerated an abrupt rotation away from mega-cap growth. Large-cap benchmarks bore the brunt of the volatility, with the Nasdaq-100 Index dropping -5.82% and the S&P 500 Index falling -4.33%. In contrast, smaller-cap segments proved far more resilient; the Russell 2000 Index increased +0.89%, while the S&P 1000 Index gained +2.83% (Figure 1).
A sharp style rotation dominated the quarter as investors favored value over growth stocks. U.S. growth benchmarks suffered steep losses: Russell 1000 Growth Index -9.78%, Russell Midcap Growth Index -6.35%, and Russell 2000 Growth Index -2.81%.
Conversely, U.S. value indices provided a critical buffer: Russell 1000 Value Index +2.10%, Russell Midcap Value Index +3.68%, and Russell 2000 Value Index +4.96%.
This divergence reflected a clear preference for companies with attractive valuations, robust cash flows, and lower sensitivity to interest-rate revisions as energy prices climbed and discount rates shifted.
Investors also rotated down the capitalization spectrum within the S&P 500 Index. Year to date, the bottom half of stocks by market cap outperformed the top half by nearly 10% on a weighted-average-return basis. The 10% performance gap represents one of the sharpest reversals of mega-cap concentration in the last decade, marking a potential shift in market regime and a move away from the “Magnificent Seven” dominance of previous years.[1]
International markets outside the U.S. were also generally down: MSCI Europe Index -2.68%, MSCI EAFE Index -1.12%, and MSCI Emerging Markets Index -0.10%.
Defensive minimum volatility strategies limited losses amid the broader risk-off sentiment triggered by escalating Middle East tensions, but results were mixed: MSCI World Minimum Volatility Index +0.22%, MSCI ACWI Minimum Volatility Index -0.18%, and MSCI USA Minimum Volatility Index -1.15%.
Figure 1:
Equity Markets Performance
YTD as of March 31, 2026
There was wide dispersion across U.S. styles, size segments, and global regions in 1Q 2026.
Factor Dynamics and Geopolitical Catalysts
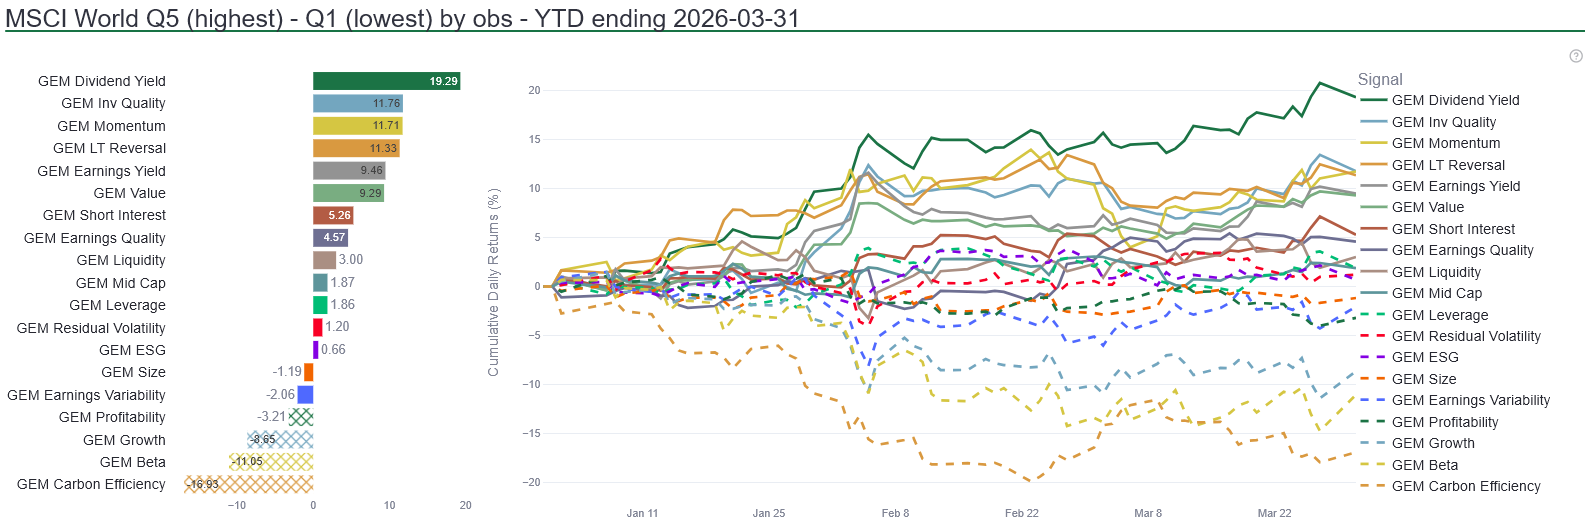
A Barra-style factor analysis of the MSCI World universe provides insight into the primary drivers of relative performance through late March 2026. Dividend Yield recorded an extraordinary positive spread at +19.29%. In a historical context, this result represents an extreme outlier move for a single quarter and reflects a systemic flight to cash flow security as military strikes involving the U.S., Israel, and Iran began in late February.
Investment Quality +11.76% and Value +9.29% further reinforced the preference for fundamental stability and attractive valuations, while Momentum +11.71% also represented a clear co-occurrence with Value. As the rotation away from mega-cap growth persisted throughout the quarter, Momentum effectively shifted to favor the same defensive and value-oriented characteristics that dominated the period.
The Middle East conflict’s escalation directly overlaps with the widening factor divergences (Figure 2). As threats to the Strait of Hormuz emerged and oil prices surged above $113 per barrel, market mechanics shifted in real-time. This “conflict premium” triggered an energy sector boom that provided a notable offset in global portfolios. Conversely, Carbon Efficiency -16.93%, Beta -11.05%, and Growth -8.65% lagged notably. Long-duration growth equities faced intense pressure due to their sensitivity to shifting risk appetites and the inflationary pass-through of energy costs. The Profitability -3.21% factor faced a drag as surging energy costs and rising discount rates compressed margins for high-operating-efficiency growth companies.
The cumulative return data shows these divergences widening sharply after mid-January, accelerating through the February airstrikes. We believe this pattern reflects a global market environment that prioritized defensive and value-oriented characteristics as uncertainty mounted. Systematic factor approaches may navigate these regimes effectively by emphasizing resilient, diversified characteristics during periods of heightened volatility.
Figure 2:
MSCI World Factor Spreads
YTD as of March 31, 2026
Evolving factor leadership for global equities using quintile spreads (Q5-Q1)
Outlook: The Risk of Duration
The case for U.S. Federal Reserve rate cuts has diminished as 10-year U.S. Treasury yields climb toward 4.4%. Rising oil prices have tightened financial conditions, effectively performing the tightening work for the Fed. While this represents a supply shock and risk premium-driven regime, the underlying economy remains resilient. Robust labor markets, steady consumer spending, and healthy corporate balance sheets provide a strong buffer against higher costs and potentially prevent a classic demand-led recession.
Equity markets now confront a bifurcated path where the duration of the conflict will dictate the long-term economic regime:
- Transient De-escalation: A swift resolution in the Strait of Hormuz (a scenario currently gaining traction in market sentiment) could trigger an immediate oil price retreat and remove a major inflationary headwind. Combined with existing economic strength, a confirmed de-escalation would likely be associated with a broad equity rally as growth-sensitive sectors regain leadership and the “uncertainty premium” evaporates.
- Persistent Structural Shift: If the conflict were to persist for several months, the supply shock could transition into a permanent structural headwind. High energy costs and disrupted trade may eventually degrade corporate margins and may erode consumer resilience. Under this scenario, even a delayed resolution may fail to spark an immediate rally, as the lag effects of “higher-for-longer” inflation take hold.
While a protracted conflict could favor defensive positioning and energy exposures, the potential for a near-term pivot toward de-escalation could argue against aggressive overweights. Elevated uncertainty at quarter-end supports maintaining a balanced, diversified exposure rather than making concentrated bets on a single geopolitical outcome.
We welcome all discussions about these observations. Please reach out to your Intech relationship manager with any questions.
About Intech
Intech is a global quantitative asset manager that applies advanced mathematics and systematic portfolio rebalancing to harness a reliable source of excess returns and a key to risk control – stock price volatility. Intech applies its investment approach across five investment platforms which differ by risk-return objective: relative or absolute. Intech also integrates fundamental-based information to identify stocks with favorable underlying characteristics, complementing its volatility-based models that target stocks with attractive trading profit potential due to their volatility characteristics. There can be no assurance that such models or characteristics will result in profitable investment outcomes, nor can there be no assurance that any such positioning will achieve its intended results. These strategies only differ by the client’s desired benchmark and risk budget and include enhanced equity, active equity, defensive equity, extension equity, and absolute return investment solutions within the U.S., global, and non-U.S. regions.