


Executive Summary
- Recent market leadership has strongly favored higher-beta stocks, and the resulting performance challenge may not reflect insufficient market exposure. Even a portfolio holding approximately 1.0 beta can underperform when returns concentrate in the highest-beta, most speculative securities.
- Increasing portfolio beta may not be a compelling solution. Higher beta represents additional systematic risk exposure and should not, by itself, be viewed as a reliable source of persistent alpha. A meaningful beta tilt can also consume a substantial share of the active-risk budget while making returns more dependent on market direction.
- Diversification creates short-term headwinds when one characteristic dominates, but it remains central to disciplined active management. Diversification can help keep active risk focused on stock selection across many names rather than market direction concentrated in a few stocks.
A Speculative Market Environment
Over the one-year period through June 30, 2026, the spread between the highest-and lowest-beta quintiles of the S&P 500 Index reached approximately 50%. Momentum also performed strongly, while profitability and earnings-quality spreads turned negative (Figure 1). Higher-beta, speculative securities rewarded investors disproportionately, but fundamental quality earned little reward.
Figure 1:
Market leadership strongly favored high-beta, speculative stocks
Factor return spreads, trailing 1-year as of June 30, 2026
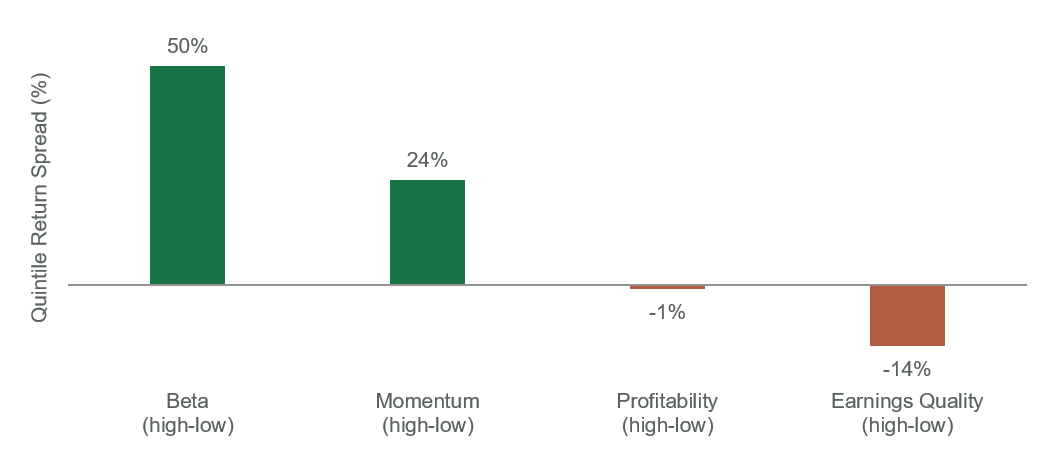
Quintile spreads of the S&P 500 Index Q5 (highest) minus Q1 (lowest) by market cap over the one-year period as of June 30, 2026. Source: Barra Global Equity Model.
This can reflect a challenge of market composition, rather than insufficient market participation. A portfolio can hold approximately the same aggregate beta as its benchmark, offsetting high-beta positions with lower-beta positions elsewhere, and still lag when the highest-beta names substantially outperform. Such a portfolio can retain broad market exposure while not sharing the market’s concentration in its highest beta names.
Why Higher Beta May Not Be the Answer
Under the Capital Asset Pricing Model (CAPM), an investor’s expected return depends on the amount of systematic risk the investor bears:
E[Ri] − Rf = βi(E[RM] − Rf)
Where E[Ri] is the expected return on security i, Rf is the risk‑free rate, βi is the security’s beta, and E[RM] is the expected return on the market.
Higher beta should command a higher expected return only as compensation for bearing additional systematic risk, not as a source of alpha. An investor could replicate similar market exposure by holding the benchmark and adding leverage, so investors should distinguish carrying more beta than the benchmark from generating return through security selection.
It also cuts both ways: A portfolio with beta above 1.0 would generally be expected to gain relative to the benchmark in a rising market and lose relative ground in a falling one, all else equal. This makes active performance partly dependent on market direction rather than the manager’s intended sources of alpha.
The empirical record offers little support for the alternative view. Fama and French (2004) found the CAPM’s empirical fit poor, with the security market line historically flatter than theory predicts. Frazzini and Pedersen (2014), studying U.S. and 20 international equity markets, found that high beta correlates with lower alpha, as leverage‑constrained investors bid up high‑beta securities to gain market exposure without leverage. Baker, Bradley, and Wurgler (2011) similarly document a long‑run tendency for high‑beta and high‑volatility stocks to underperform lower‑risk stocks, and they tie this pattern to the same leverage‑constraint dynamic.
None of this implies a portfolio should mechanically favor low beta. It only means investors have little reason to regard structurally higher beta as a reliable source of long‑term alpha.
Tracking Error Changes the Calculus
For a portfolio operating within a 1.5% to 3.0% tracking error objective, active risk is scarce, and a beta tilt is not a costless way to capture more return. A useful approximation calculates the tracking error the beta difference contributes:
TEβ ≈ |βP − βB|σB
Where TEβ is the tracking error attributable to the portfolio’s beta difference, βP is the portfolio’s beta, βB is the benchmark’s beta, and σB is the benchmark’s volatility.
If benchmark volatility is 16% and beta rises from 1.00 to 1.10, the tilt alone contributes roughly 1.6% of tracking error (about 64% of a 2% active-variance budget), since independent risk sources combine in variance rather than linearly (1.6²/2.0² = 64%).
Figure 2:
Beta-tilt tracking error contribution across benchmark volatility regimes
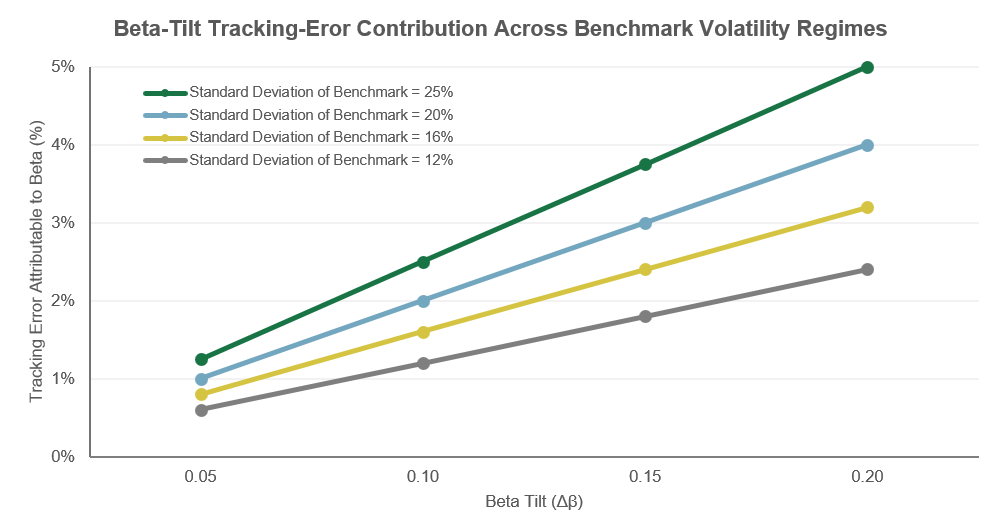
The effect is considerably smaller for a mandate with a broader 4% to 6% tracking-error budget. Using the same example, a 0.10 beta tilt at 16% benchmark volatility still contributes about 160 bps, or 1.6%, of tracking error in absolute terms, but that represents only about 16% of a 4% tracking error budget, 10% of a 5% budget, and 7% of a 6% budget, versus 64% of a 2% budget.
For a higher tracking error mandate, the issue is less that beta overwhelms the risk budget and more a question of what the manager chooses to spend the additional capacity on. A higher tracking error manager has greater capacity to carry a beta tilt, but doing so still makes active returns more dependent on market direction rather than the manager’s intended sources of alpha.
This approximation segregates the beta term in isolation, however. A fuller decomposition captures how the beta tilt interacts with the rest of the portfolio:
TEβ² ≈ (βP − βB)²σB² + σresidual² + 2*Cov(beta tilt, residual positions)
Where σresidual is the tracking error that the portfolio’s other active positions contribute, and Cov(beta tilt, residual positions) is the covariance between the beta tilt and those other positions.
When a manager’s highest-conviction stock selection ideas cluster in high-beta names (which can occur in a narrow speculative rally), the true cost of a beta tilt can exceed the naive estimate, because the tilt compounds rather than diversifies the portfolio’s other active risk. A risk committee evaluating a beta tilt should ask whether its estimated tracking-error cost reflects a covariance-aware model or the simplified heuristic alone.
Diversification in a Narrow Market
A genuinely diversified portfolio generally will not maximize exposure to whatever characteristic is currently leading the market. In a narrow, speculative rally that means capturing less of the upside than a portfolio concentrated in the winning exposure. Increasing exposure to the highest-beta stocks might have improved recent returns, but it would also have increased the portfolio’s dependence on that leadership continuing, and leaving it more exposed if the leadership reverses.
This does not argue for avoiding high-beta stocks altogether. A high-beta stock could still be attractive if its expected stock-specific return justifies the position, as long as offsetting positions elsewhere keep aggregate beta close to the benchmark. The investment case for an individual stock should not automatically translate into a directional market bet at the portfolio level.
Historical Precedent for Narrow, Speculative Leadership
Narrow, high-beta-led markets are not new. The late-1990s technology boom provides a historical precedent for concentrated leadership in speculative technology and growth stocks. Following the Nasdaq Composite’s March 2000 peak, the index fell roughly 78% through its October 2002 trough and illustrates the potential for a sharp reversal when speculative leadership unwinds.
A more recent episode followed the initial post-COVID recovery. From April 1, 2020 through December 31, 2021, high-beta stocks significantly outperformed low-beta stocks, based on the return spread between Quintile 5 (highest beta stocks) and Quintile 1 (lowest beta stocks) by market capitalization within the S&P 500 Index. High-beta growth stocks were among the beneficiaries of the post-pandemic market rebound, along with strong retail participation, elevated SPAC activity, and strong performance among richly valued, unprofitable growth companies.
That leadership reversed sharply in 2022. The Q5-minus-Q1 return spread was approximately -40% during the calendar year, as high-beta stocks significantly underperformed their low-beta counterparts.
These episodes do not imply that the current market will follow the same path. They do, however, provide historical examples of how narrow, speculative leadership can reverse when market conditions change, and underscores the importance of considering diversification and valuation alongside recent performance.
Questions an Allocator Should Ask a Manager During a Speculative Rally
The distinctions above translate into concrete due diligence questions an institutional investor can put to any active manager, including this one, when relative performance lags during a narrow, high-beta-led market:
- Attribution: How much of the underperformance comes from aggregate beta versus stock selection?
- Concentration within beta: Of the portion that beta does not explain, how much concentrates in the specific highest-beta names driving market leadership, rather than spreading broadly?
- Risk-model methodology: Does the tracking error budget for a proposed beta tilt reflect a covariance-aware model, or the simplified heuristic alone?
- Intentionality: Has beta drifted upward as a byproduct of stock-specific conviction, or would closing the gap require deliberately adding market exposure? The two carry very different risk implications.
Asking these questions consistently, in both strong and weak periods, helps distinguish a manager whose process is behaving as designed from one whose beta has drifted for reasons unrelated to stock selection.
Conclusion
Maintaining benchmark-like beta does not guarantee participation in every source of market leadership. When returns concentrate in the most speculative, highest-beta stocks, a diversified portfolio can lag even while holding approximately the same market sensitivity as its benchmark. This can result from the composition and concentration of that leadership rather than insufficient market exposure.
Structurally increasing beta would not necessarily address this; theory and empirical evidence suggest that higher beta represents additional systematic risk exposure rather than, by itself, a reliable source of persistent alpha. For a tightly risk-controlled mandate, a beta tilt can also consume a substantial share of the tracking error budget while making results more dependent on market direction.
We would argue the objective is not to chase beta, but to maintain appropriate market exposure while deploying a limited active-risk budget across diversified sources of expected excess return.
About Intech
Intech is a global quantitative asset manager that applies advanced mathematics and systematic portfolio rebalancing to seek excess return opportunities associated with stock price volatility while managing portfolio risk. Intech applies its investment approach across five investment platforms which differ by risk-return objective: relative or absolute.
Intech also integrates fundamental-based information to identify stocks with favorable underlying attributes, complementing its volatility-based models that seek to identify stocks with characteristics associated with trading profit potential.* These strategies may be tailored to specific investor needs and include enhanced equity, active equity, defensive equity, extension equity, and absolute return investment solutions within the U.S., global, and non-U.S. regions.
*There can be no assurance that such models or characteristics will result in profitable investment outcomes, nor that any such positioning will achieve its intended results.