


Introduction
The third quarter of 2026 presented an unusual contrast across equity markets. A sharp rise in U.S. bond yields created a more challenging backdrop for rate-sensitive and smaller companies, yet U.S. large-cap indices remained resilient as strong earnings and continued AI-related investment supported many of the market’s largest technology companies.
Beneath the headline indices, however, narrow participation and a sharp reversal in momentum revealed meaningful changes in market leadership. These crosscurrents of higher rates, durable earnings growth, and increasingly concentrated leadership defined the quarter and will be important to watch as markets enter the final months of 2026.
Theme 1: Rising Yields Reshaped Equity Market Leadership
Takeaway: A sharp rise in U.S. bond yields created a more difficult backdrop for rate-sensitive equities and helped widen the divide between U.S. large caps and smaller companies.
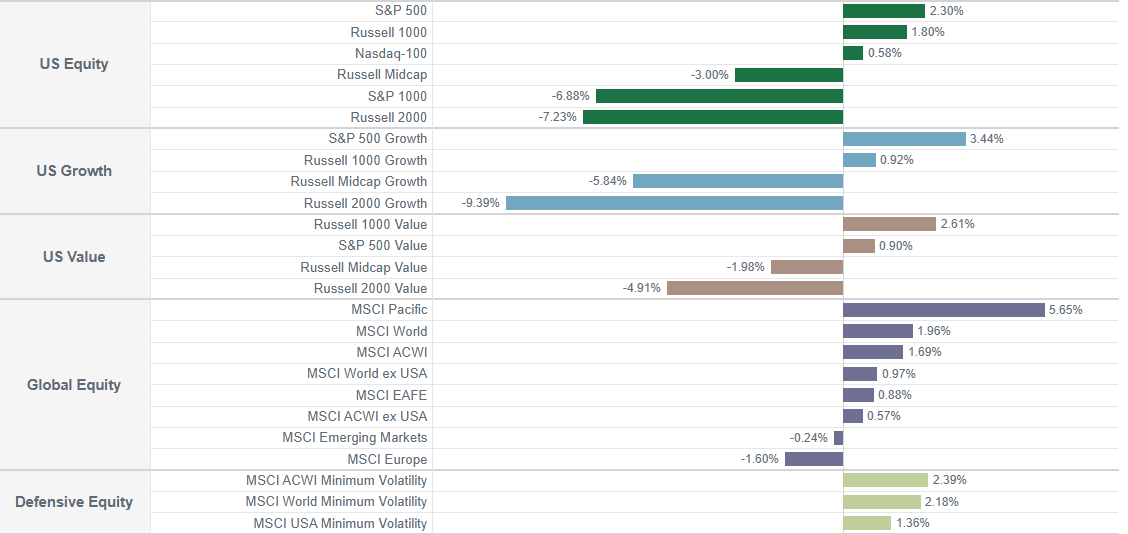
Figure 1:
Equity Markets Performance – Q3 2026
Data: FactSet
The quarter produced a pronounced split across U.S. market capitalizations. Large-cap equity indices remained positive, while mid- and small-cap equities declined materially. That divergence coincided with a substantial increase in long-term interest rates, including a roughly 85 basis point rise in the 10-year Treasury yield. Higher financing costs and tighter financial conditions may have contributed to the relative weakness in smaller companies, which are often more sensitive to credit conditions and the domestic economic outlook. The increasingly restrictive rates backdrop, therefore, may have weighed more heavily on small caps.
Large-cap growth was notably resilient despite the rise in yields. Ordinarily, higher real rates create a headwind for long-duration growth assets, yet many of the largest technology companies continued to attract capital. Their strong balance sheets, cash generation, and earnings growth may have contributed to their relative resilience as investors became more selective.
This was not a broad growth rally: performance deteriorated sharply moving down the capitalization spectrum, suggesting that company size, financing sensitivity, and earnings durability mattered alongside style.
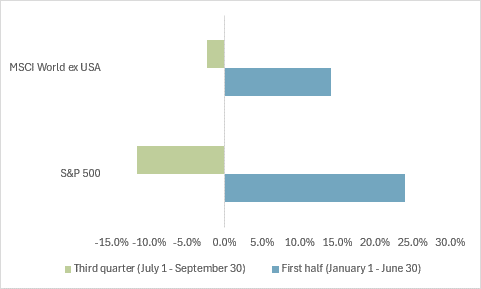
Furthermore, the change in factor leadership was particularly evident in momentum. During the first half of the year, the highest-momentum stocks substantially outperformed the lowest-momentum stocks in both the S&P 500 and MSCI World ex USA Indexes (Figure 2). That relationship reversed in Q3, with the reversal particularly pronounced in the U.S.
Importantly, the reversal did not represent a broad rotation away from the AI and technology theme. Technology remained a leading source of S&P 500 Index returns, supported by Software and Services and several mega-cap technology companies. Instead, the market rotated among companies and characteristics within the broader theme, demonstrating how quickly leadership can change even when the dominant investment narrative remains intact.
Figure 2:
Momentum Reversal – Q5 (highest) minus Q1 (lowest) by Market Cap in 2026
Data: Barra
What to Watch: Can Earnings Offset Higher Yields?
The central question is whether the divergence created by higher yields persists. Strong earnings have so far allowed U.S. large caps to absorb a substantial increase in rates, while smaller companies and prior momentum leaders have been considerably more vulnerable. If yields remain elevated while earnings expectations continue to rise, the market could remain divided between companies able to deliver growth from internally-generated cash flow and those more exposed to financing conditions. A stabilization in yields, however, could remove an important headwind for small- and mid-cap companies and create better conditions for broader participation.
Factor performance will provide another indication of whether the underlying regime is changing. A sustained recovery in momentum would suggest that the previous leadership structure is reasserting itself, while continued strength in profitability and quality characteristics would point toward a more durable shift in what investors are rewarding.
Theme 2: U.S. Index Resilience Masked Concentration
Takeaway: The S&P 500 Index remained positive, but its resilience depended heavily on a narrow group of technology-related leaders. Outside the U.S., participation and return drivers were generally more varied.
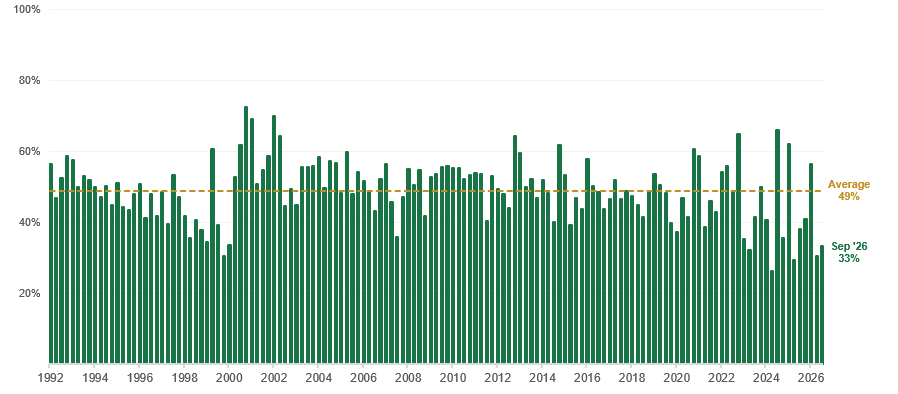
Positive S&P 500 Index returns masked unusually narrow participation. Only about one-third of its constituents outperformed the index, while breadth was stronger across several smaller-cap and non-U.S. benchmarks (Figure 3). Viewed historically, Q3 2026 ranked as the sixth-lowest quarterly breadth reading for the S&P 500 Index among 139 quarters since 1992. Even more striking, four of the five lowest-breadth quarters since 1992 occurred in the second quarter of each year from 2023 through 2026; the only other quarter among the five lowest was Q4 1999. Therefore, U.S. large-cap resilience reflected the strength of a relatively small group of companies rather than broad participation across the market.
Figure 3:
S&P 500 Index Percent of Stocks Outperforming – Quarterly (1Q 1992 – 3Q 2026)
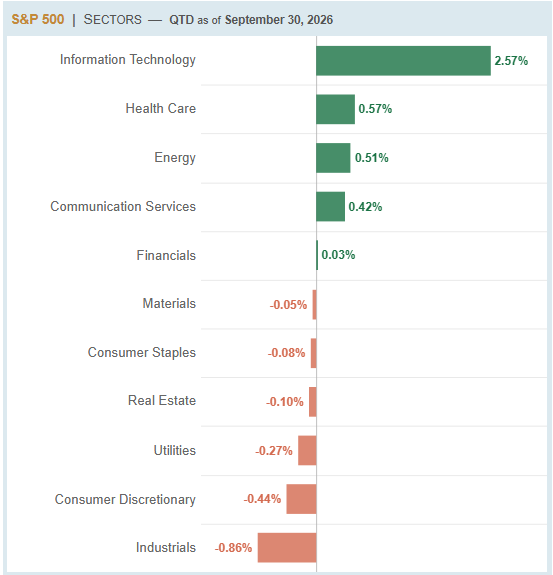
Return contribution makes the concentration even clearer. Information Technology contributed more than the S&P 500 Index’s entire quarterly gain, with Software & Services accounting for most of that contribution. Weakness across several other sectors and industries offset part of those gains.
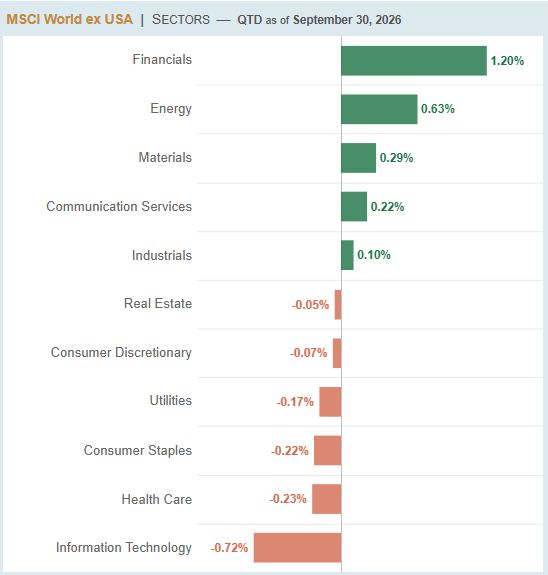
Outside the U.S., positive sector contributions were more broadly distributed (Figure 4). Information Technology dominated the S&P 500 Index contribution profile, while MSCI World ex USA Index drew support from a more varied mix of sectors, led by Financials, Energy, Materials, and Communication Services. Some of the difference in magnitude reflects the stronger overall return of the S&P 500 Index, but the comparison reinforces the broader point: U.S. large-cap performance was unusually dependent on a narrow set of sectors and, ultimately, a very small number of stocks.
Figure 4:
Sector Contributions – Q3 2026
Data: FactSet
The concentration was even more pronounced at the stock level. Microsoft, NVIDIA, Apple, and Meta contributed a combined 4.23% to the S&P 500 Index’s quarterly return, while the remaining constituents collectively detracted 1.92%.[1] The index nevertheless finished the quarter up 2.30%. In other words, the four largest contributors generated more than the index’s entire quarterly gain and masked negative performance from the rest of the market in aggregate.
All this helps explain why the headline index remained resilient despite weak breadth and rising bond yields. Performance was not simply concentrated in a leading sector; it was concentrated within a small group of companies whose earnings strength, balance sheets, and exposure to secular technology themes may have contributed to their relative resilience as financial conditions tightened. The result was an unusually large gap between the performance of the capitalization-weighted index and the experience of the broader market.
What to Watch: Will Earnings Leadership Broaden?
The durability and breadth of earnings growth may now matter more than the absolute level of market valuations. Strong earnings expectations may have helped equities absorb a significant rise in yields without a broad large-cap decline. If earnings remain strong and confidence in their durability improves, one possible outcome is that valuation multiples rise alongside earnings. However, weaker earnings, slower economic growth, persistent inflation, or higher interest rates could pressure valuations and equity returns. That outcome could extend the market advance, but it could also deepen concentration if earnings leadership remains centered on AI-related companies.
A broader expansion in earnings would provide a healthier foundation for wider market participation. The key question, therefore, is not simply whether earnings remain strong, but whether earnings leadership itself begins to broaden and inflation fears lessen.
That question is particularly important for the AI investment cycle. AI capital-spending expectations have continued to rise, while evidence of productivity benefits from that investment is still emerging in corporate results. While uncertain, if AI adoption translates into stronger productivity and margins across a wider range of companies, earnings leadership could broaden beyond the businesses building the infrastructure. If those gains fail to materialize, the scale of AI capital spending and the market’s dependence on a narrow group of leaders would become increasingly important risks.
Conclusion
Looking ahead, the tension between higher rates and strong corporate fundamentals will be central to the market outlook. Earnings growth may have helped U.S. large caps absorb a substantial increase in yields, but narrow breadth shows that this resilience remains dependent on a relatively small group of companies.
Outside the U.S., market leadership has been less concentrated, with sector contributions more evenly distributed and stock-level participation generally broader. That distinction could become increasingly important if higher yields continue to challenge the narrow leadership supporting U.S. large-cap indices.
The AI investment cycle remains an important contributor to market performance, and the next phase may depend on whether that spending translates into broader productivity and margin gains across the economy. If it does, earnings and market leadership could broaden; if it does not, equity returns may remain increasingly dependent on the durability of earnings growth among today’s largest technology leaders.
About Intech
Intech is a global quantitative asset manager that applies advanced mathematics and systematic portfolio rebalancing to seek excess return opportunities associated with stock price volatility while managing portfolio risk. Intech applies its investment approach across five investment platforms which differ by risk-return objective: relative or absolute.
Intech also integrates fundamental-based information to identify stocks with favorable underlying attributes, complementing its volatility-based models that seek to identify stocks with characteristics associated with trading profit potential.* These strategies may be tailored to specific investor needs and include enhanced equity, active equity, defensive equity, extension equity, and absolute return investment solutions within the U.S., global, and non-U.S. regions.
*There can be no assurance that such models or characteristics will result in profitable investment outcomes, nor that any such positioning will achieve its intended results.