


Small caps are having their best relative year in over a decade. Through early July 2026, the Russell 2000 Index has returned +24% versus +11% for the S&P 500 Index: a spread of more than 13 percentage points. After years of large-cap dominance driven by mega-cap tech concentration, this reversal has investors asking if this is the start of a sustained rotation.
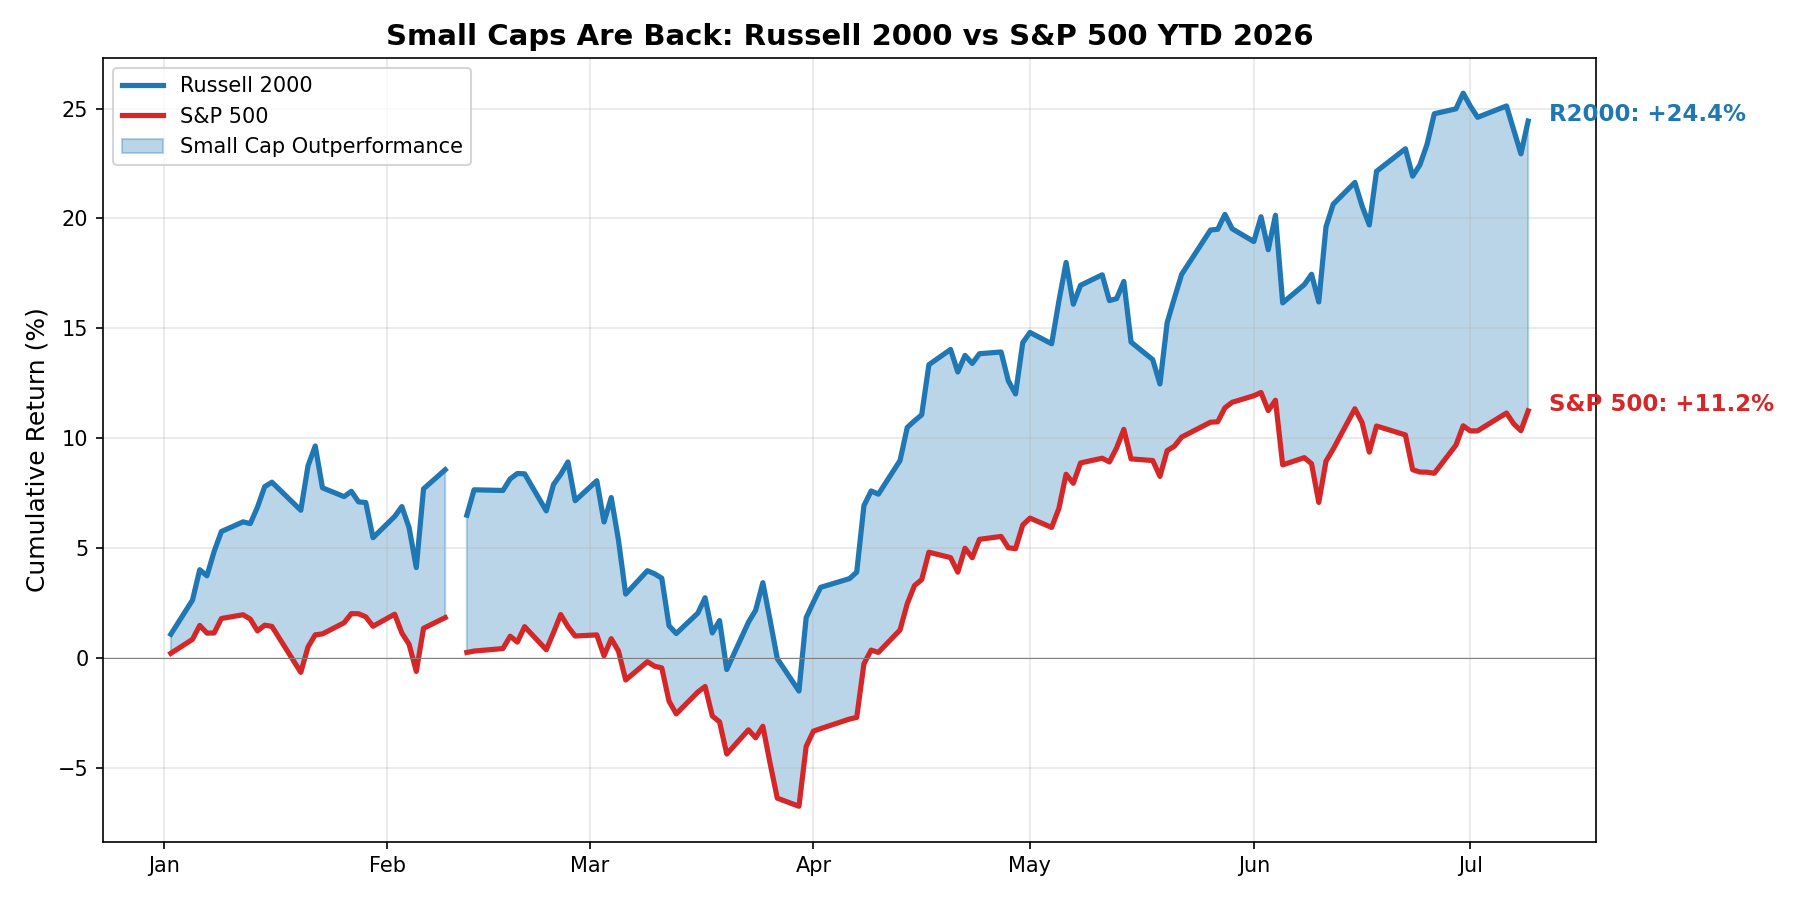
Returns tell us what happened. Attribution tells us why.
Understanding a move of this magnitude requires looking beyond the headline numbers. Not all outperformance is created equal.
The following chart illustrates how the performance breakdown is more nuanced than the raw return spread suggests.
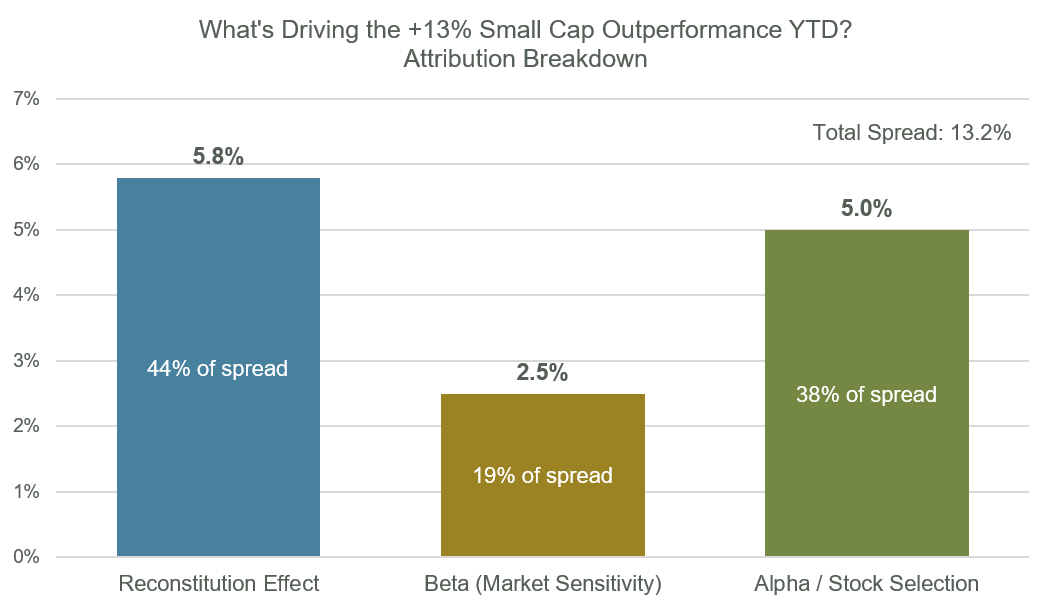
Of the roughly 13% performance advantage, approximately 6% (44% of the spread) comes from index reconstitution effects. The Russell 2000 Index’s annual rebalancing mechanically boosts performance as graduating stocks are replaced by fresh small-cap constituents. This is a structural feature, not alpha.
Another 2.5 percentage points (19%) reflects the higher market beta of small caps. In a strong up-market, they amplify gains; however, they’ll amplify losses just as readily in a downturn.
That leaves approximately 5 percentage points (38%) of outperformance, which cannot be explained by mechanical or systematic factors.
The rally has been real, but much of its magnitude reflects mechanics rather than fundamentals.
The options market tells a different story.
Historically, investors have paid a higher premium to hedge small-cap crash risk than large-cap crash risk. This makes intuitive sense because small caps tend to be more volatile and less liquid.
Today, protecting the S&P 500 Index is more expensive than protecting the Russell 2000 Index relative to their underlying constituents. The current reading sits at the 4th percentile of the historical distribution. This is significant because, in 11 years of data, large-cap crash premiums have rarely exceeded small-cap premiums by this much.
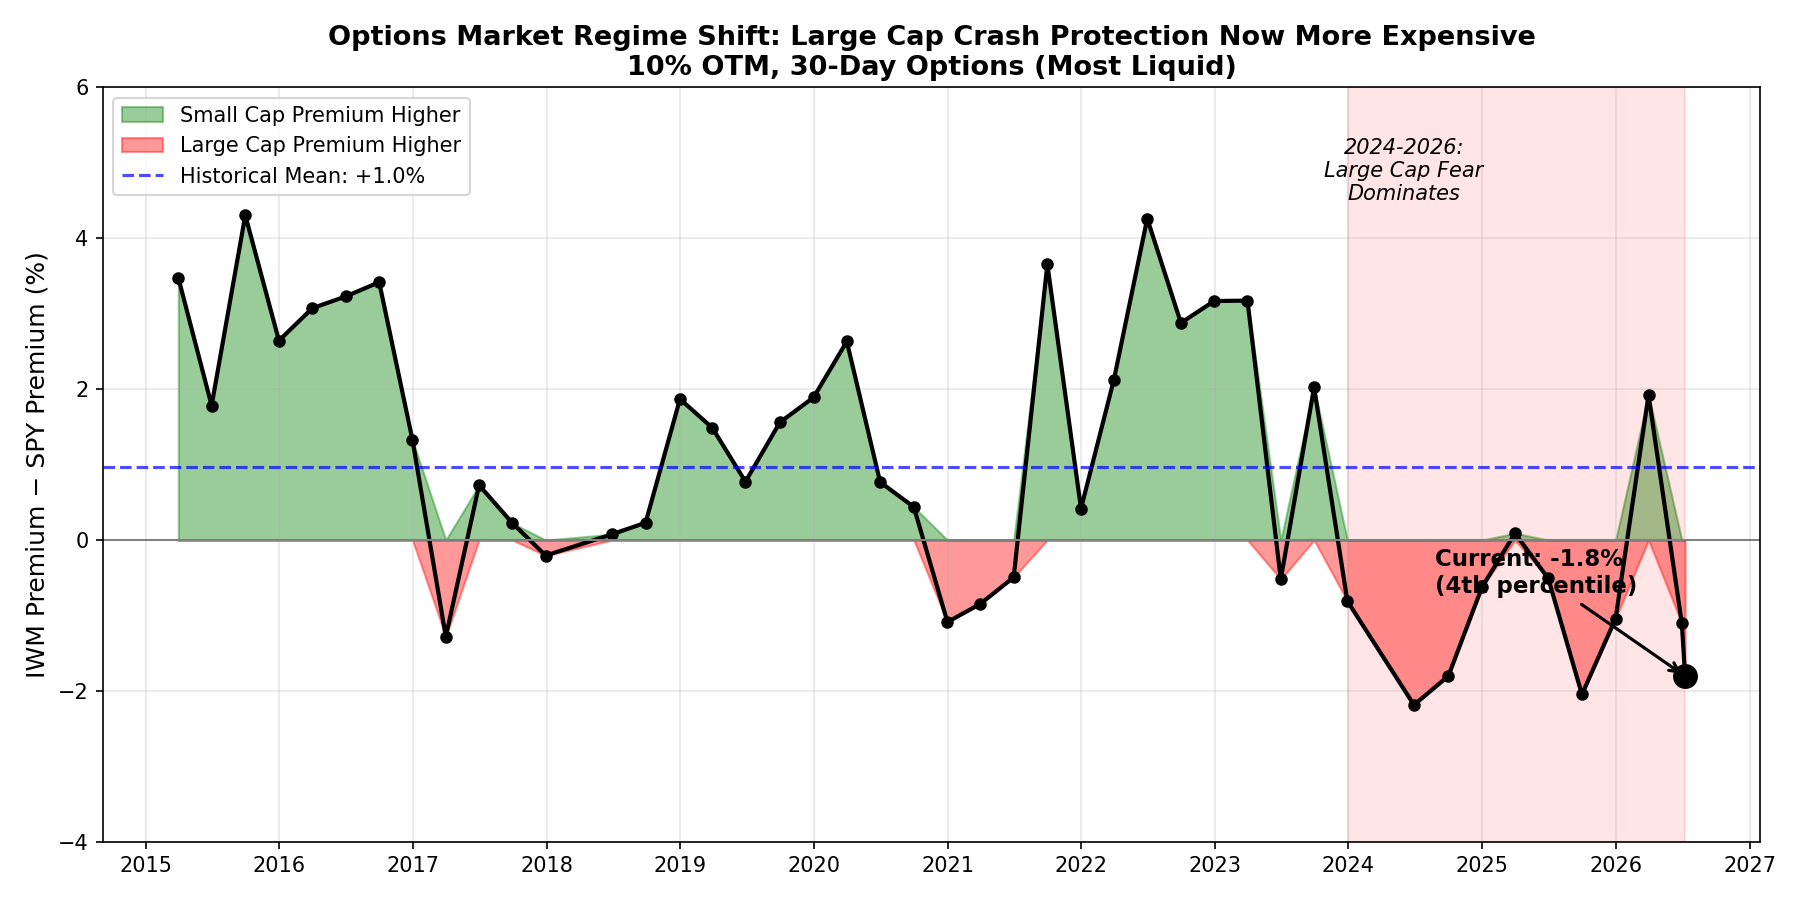
Methodology: Index premium calculated using 10% OTM, 30-day put options (most liquid). Component skew is the cap-weighted average of individual stock put skews using point-in-time index constituents with quarterly rebalancing. Data source: iVolatility, FactSet.
This divergence does not tell us which market is right. But it does tell us that equity flows and options flows are sending conflicting signals.
Whether that reflects lingering worries over tech concentration, skepticism about the sustainability of the small-cap rally, or simply positioning imbalances — the divergence between realized returns and implied risk is historically unusual and worth watching.
About Intech
Intech is a global quantitative asset manager that applies advanced mathematics and systematic portfolio rebalancing to harness a reliable source of excess returns and a key to risk control – stock price volatility. Intech applies its investment approach across five investment platforms which differ by risk-return objective: relative or absolute.
Intech also integrates fundamental-based information to identify stocks with favorable underlying characteristics, complementing its volatility-based models that target stocks with attractive trading profit potential due to their volatility characteristics.* These strategies only differ by the client’s desired benchmark and risk budget and include enhanced equity, active equity, defensive equity, extension equity, and absolute return investment solutions within the U.S., global, and non-U.S. regions.
*There can be no assurance that such models or characteristics will result in profitable investment outcomes, nor that any such positioning will achieve its intended results.