How Much More Volatility Can You Take?

Topics: , ,

Published on February 23, 2023

| 12 min read

Richard Yasenchak, CFA, Head of Client Portfolio Management

Share:

Your equity strategies are typically your largest source of portfolio volatility, and it’s clear we’re seeing more pronounced and frequent equity volatility today. Market pundits will attribute it to economic cycles, geopolitical uncertainty, algorithmic trading, market sentiment, etc., but regardless of how one ascribes today’s volatility, we know it’s different. More importantly, it may also be more difficult to manage.

Volatility is a critical factor in investment decisions and the trends we’re seeing in equity volatility have potentially insidious consequences:

Of course, we’re big advocates of using defensive equity solutions, but we also recognize the limits of traditional risk management techniques, especially in today’s markets. The tools required to mitigate and diversify the evolving face of equity volatility must change – and capturing the upside is essential. Investors need innovation in equity investing.

Rising Long-term Volatility

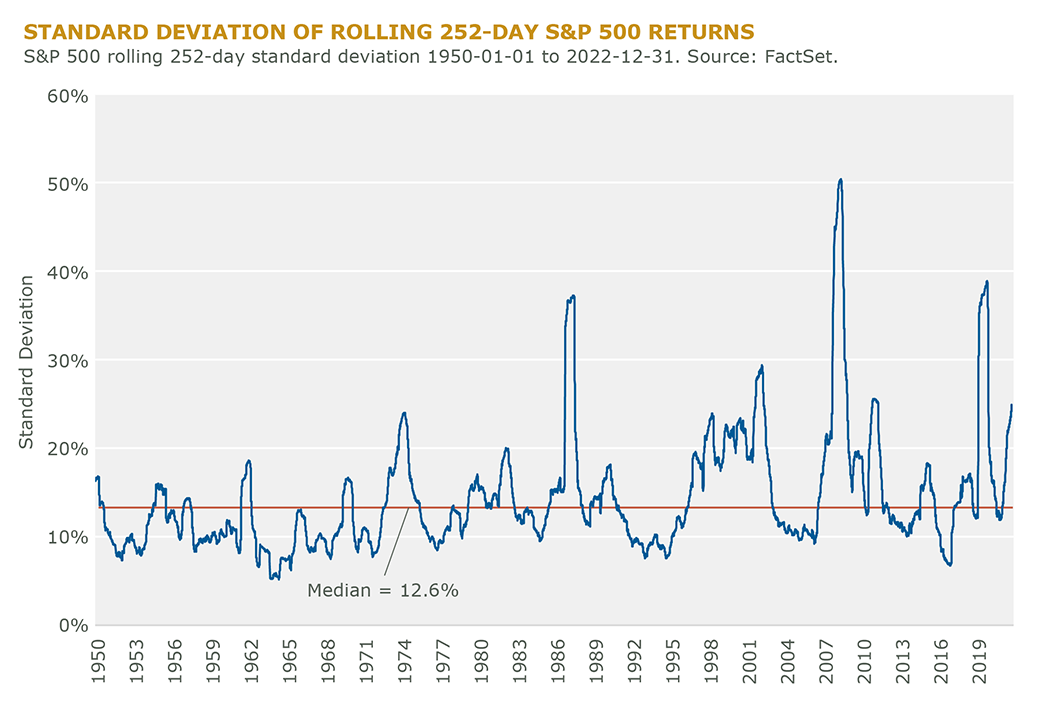
The volatility we’re experiencing today is not what your predecessors managed. The median standard deviation of rolling one-year S&P 500 returns in the post-WWII period has been 12.6% (see figure below), which is acceptable to many investors given the market’s returns during that period; however, you might not want to build your asset allocation on it.

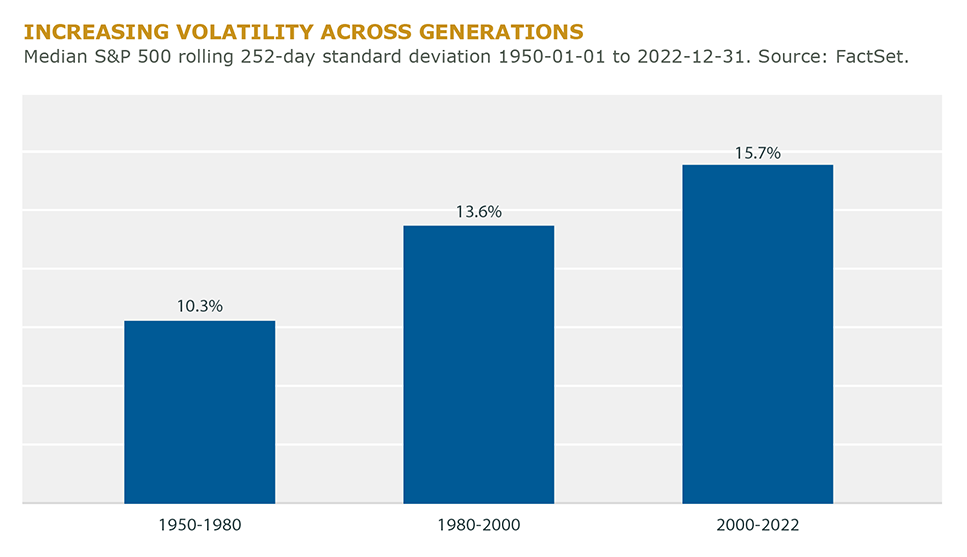
Volatility has been steadily rising over the decades. Median volatility from 1950 to 1980 was only 10.3%. It rose to 13.6% in the subsequent 20 years. Since the turn of the millennium, median equity market volatility has jumped to 15.7% — a 50% increase in 40 years (see figure below).

Higher Short-term Volatility

The increasing magnitude of long-term volatility has been accompanied by higher bouts of short-term volatility. These episodes are just as important as long-term volatility for the reasons we’ve outlined, yet they are more challenging to mitigate without hedges that can impair upside capture and result in excessive trading expenses.

We examined the frequency of daily returns that exceed two standard deviations above their mean since 1950, which are about ± 2% return days. These are very big daily moves in the market. Only 154 trading days in the 30 years between 1950 and 1980 exceeded this threshold. The share of such events doubled to 4% between 1980 and 2000, and since 2000, investors have seen 9% of trading days exceeding this threshold. That’s more than a four-fold increase since 1980.

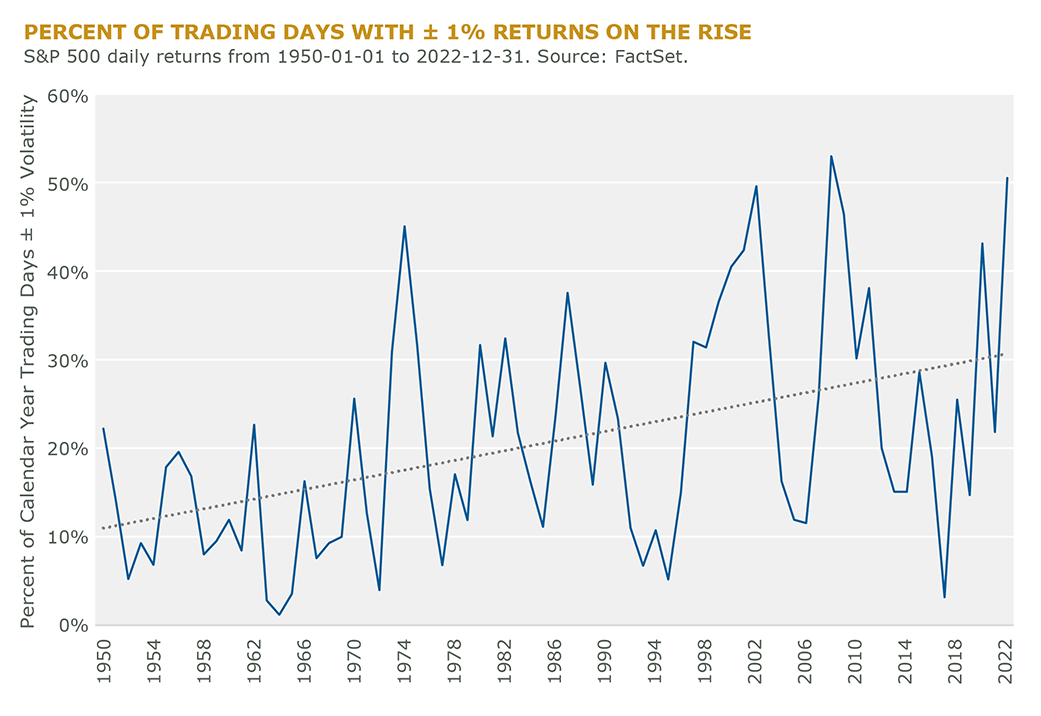
We’ll concede that risk-seeking investors may be comfortable with navigating 2nd percentile events; however, one standard deviation events (± 1% return day) have also been marching higher. Below are the percentage of trading days in each calendar year with ± 1% returns (see figure below). Over 50% of the trading days in 2022 moved ± 1%.

The Long and Short of It

We can map long- and short-term volatility cycles by comparing the rolling 252-day standard deviation of daily returns illustrated in the first figure to a rolling 20-day standard deviation of daily returns (see figure below).

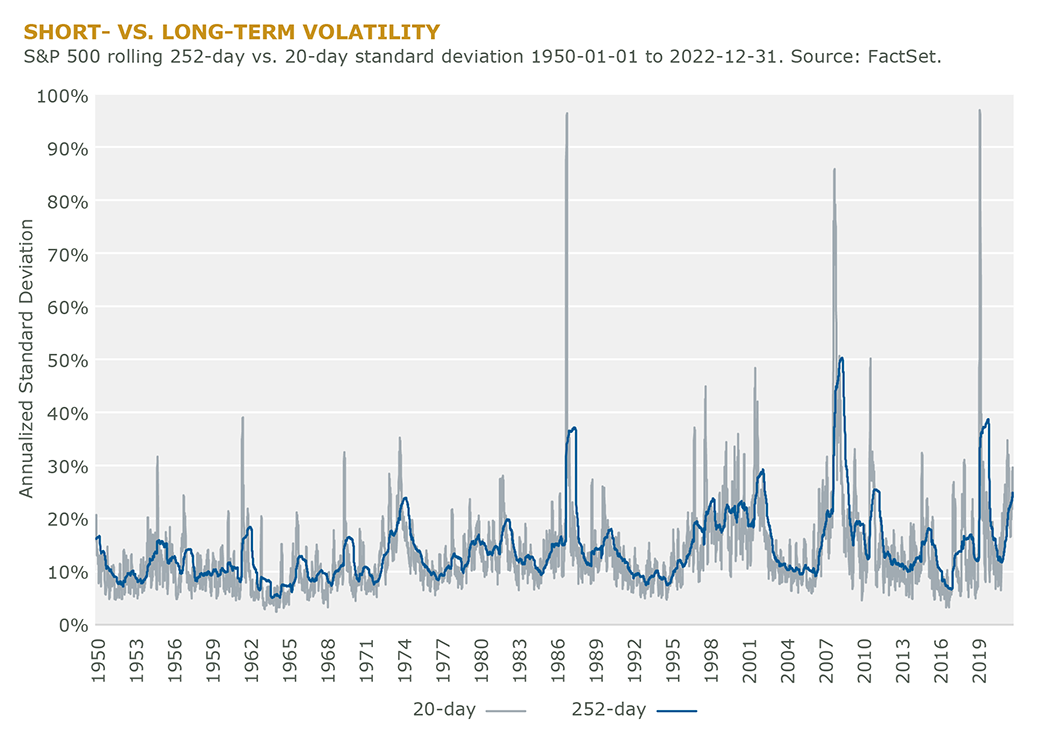
The illustration makes clear the increasing short-term volatility spikes relative to the longer-term volatility cycles most equity strategies are designed to mitigate. To address these short-term volatility events, traditional equity risk management techniques often require higher trading frequency or detract from capturing upside opportunities. They are generally inadequate to address both cycles efficiently while still delivering alpha.

To that end, Intech has developed an all-season equity strategy that attempts to efficiently address long- and short-term volatility cycles to deliver:

  • more positively skewed investment returns;
  • reduced systemic risk exposure;
  • improved diversification; and
  • higher risk-adjusted returns.

The Intech team is excited to introduce this new, innovative investment solution in the coming months. Designed for today’s evolving equity markets, the strategy seeks to consistently outperform the capitalization-weighted equity market with less risk while boosting performance during extreme short-term market moves.

If you’d like to learn more, don’t hesitate to contact us.


Are You Using the Right Tools to Manage Market Volatility? Learn More


For U.S. Investors:

The views presented are for general informational purposes only and are not intended as investment advice, as an offer or solicitation of an offer to sell or buy, or as an endorsement, recommendation, or sponsorship of any company, security, advisory service, or fund. Nor do they purport to address the financial objectives or specific investment needs of any individual reader, investor, or organization. The views are subject to change at any time based upon market or other conditions, are current as of the date indicated, and may be superseded by subsequent market events or other conditions. The information, analyses and/or opinions expressed are for general information only, and are not intended to provide any specific financial, economic, tax, legal, investment advice, or recommendations for any investor. It should not relied on as the sole basis for investment decisions. While every attempt is made to ensure that all information is accurate, there is no representation or warranty, express or implied, as to the accuracy and completeness of the statements or any information contained in this report. Any liability therefore (including in respect of direct, indirect, or consequential loss or damage) is expressly disclaimed.

Past performance is no guarantee of future results. Investing involves risk, including fluctuation in value, the possible loss of principal, and total loss of investment. Information containing any historical information, data, or analysis should not be taken as an indication or guarantee of any future performance, analysis, forecast, or prediction.

An index is unmanaged, is not available for direct investment, and does not reflect the deduction of management fees or other expenses.

S&P 500 Dow Jones Indices LLC and/or its affiliates make no express or implied warranties or representations and shall have no liability whatsoever with respect to any S&P data contained herein. The S&P data has been licensed for use by Intech and may not be further redistributed or used as a basis for other indices or any securities or financial products. This presentation has not been approved, reviewed, or produced by S&P Dow Jones Indices LLC. For more information on any of S&P Dow Jones Indices LLC’s indices, please visit www.spdji.com.

This presentation or information contained in it may be restricted by law, may not be reproduced or referred to without express written permission or used in any jurisdiction or circumstance in which its use would be unlawful. We are not responsible for any unlawful distribution of this material to any third parties, in whole or in part. The contents of this material have not been approved or endorsed by any regulatory agency.

For Europe Investors – Important Information:

The views presented are for general informational purposes only and are not intended as investment advice, as an offer or solicitation of an offer to sell or buy, or as an endorsement, recommendation, or sponsorship of any company, security, advisory service, or fund. Nor do they purport to address the financial objectives or specific investment needs of any individual reader, investor, or organization. The views are subject to change at any time based upon market or other conditions, are current as of the date indicated, and may be superseded by subsequent market events or other conditions. The information, analyses and/or opinions expressed are for general information only, and are not intended to provide any specific financial, economic, tax, legal, investment advice, or recommendations for any investor. It should not relied on as the sole basis for investment decisions. While every attempt is made to ensure that all information is accurate, there is no representation or warranty, express or implied, as to the accuracy and completeness of the statements or any information contained in this report. Any liability therefore (including in respect of direct, indirect, or consequential loss or damage) is expressly disclaimed.

This document is intended solely for the use of professionals, defined as Eligible Counterparties or Professional Clients, and is not for general public distribution.

Past performance does not predict future returns. Marketing communication. The value of an investment and the income from it can fall as well as rise and investors may not get back the amount originally invested. There is no assurance the stated objective(s) will be met. Nothing in this document is intended to or should be construed as advice. This document is not a recommendation to sell, purchase or hold any investment.

There is no assurance that the investment process will consistently lead to successful investing. Any risk management process discussed includes an effort to monitor and manage risk which should not be confused with and does not imply low risk or the ability to control certain risk factors.

Various account minimums or other eligibility qualifications apply depending on the investment strategy, vehicle or investor jurisdiction. We may record telephone calls for our mutual protection, to improve customer service and for regulatory record keeping purposes.

Issued in Europe by Janus Henderson Investors. Janus Henderson Investors is the name under which investment products and services are provided by Janus Henderson Investors International Limited (reg no. 3594615), Janus Henderson Investors UK   Limited (reg. no. 906355), Janus Henderson Fund Management UK Limited (reg. no. 2678531), Henderson Equity Partners Limited (reg. no.2606646), (each registered in England and  Wales at 201 Bishopsgate, London EC2M 3AE and regulated by the Financial  Conduct Authority) and Janus Henderson Investors Europe S.A. (reg no. B22848 at 2 Rue de Bitbourg, L-1273, Luxembourg and regulated by the Commission de Surveillance du Secteur Financier). Investment management services may be provided together with participating affiliates in other regions.

Janus Henderson, Knowledge Shared and Knowledge Labs are trademarks of Janus Henderson Group plc or one of its subsidiaries. © Janus Henderson Group plc. 

For Australian Investors:

This information is issued by Intech Investment Management LLC (Intech) and is intended solely for the use of wholesale clients, as defined in section 761G of the Corporations Act 2001 (Cth) and is not for general public distribution. Intech is permitted to provide certain financial services to wholesale clients pursuant to an exemption from the need to hold an Australian financial services licence under the Corporations Act 2001. Intech is regulated by the United States Securities & Exchange Commission (SEC) under U.S. laws, which differ from Australian laws. By receiving this information you represent that you are a wholesale client.

The views presented are for general informational purposes only and are not intended as investment advice, as an offer or solicitation of an offer to sell or buy, or as an endorsement, recommendation, or sponsorship of any company, security, advisory service, or fund. Nor do they purport to address the financial objectives or specific investment needs of any individual reader, investor, or organization. The views are subject to change at any time based upon market or other conditions, are current as of the date indicated, and may be superseded by subsequent market events or other conditions. The information, analyses and/or opinions expressed are for general information only, and are not intended to provide any specific financial, economic, tax, legal, investment advice, or recommendations for any investor. It should not relied on as the sole basis for investment decisions. While every attempt is made to ensure that all information is accurate, there is no representation or warranty, express or implied, as to the accuracy and completeness of the statements or any information contained in this report. Any liability therefore (including in respect of direct, indirect, or consequential loss or damage) is expressly disclaimed.

Past performance is no guarantee of future results. Investing involves risk, including fluctuation in value, the possible loss of principal, and total loss of investment. Information containing any historical information, data, or analysis should not be taken as an indication or guarantee of any future performance, analysis, forecast, or prediction.

An index is unmanaged, is not available for direct investment, and does not reflect the deduction of management fees or other expenses.

S&P 500 Dow Jones Indices LLC and/or its affiliates make no express or implied warranties or representations and shall have no liability whatsoever with respect to any S&P data contained herein. The S&P data has been licensed for use by Intech and may not be further redistributed or used as a basis for other indices or any securities or financial products. This presentation has not been approved, reviewed, or produced by S&P Dow Jones Indices LLC. For more information on any of S&P Dow Jones Indices LLC’s indices, please visit www.spdji.com.

This presentation or information contained in it may be restricted by law, may not be reproduced or referred to without express written permission or used in any jurisdiction or circumstance in which its use would be unlawful. We are not responsible for any unlawful distribution of this material to any third parties, in whole or in part. The contents of this material have not been approved or endorsed by any regulatory agency.