Seasoned investors know full well that periodic, significant declines are a natural part of both economic and equity market cycles. This is the price paid for equities’ attractive capital appreciation, and their place as a cornerstone asset class for long-term investors would seem to indicate most consider it a fair bargain. Asset allocators understand this risk and model their allocations accordingly.
But while capital market assumptions update regularly, the frequency, magnitude, and duration of equity market drawdowns are often embedded in the model. The past few years have seen several sharp drawdowns in rapid succession, prompting many institutional investors to contemplate a “regime change.” We definitely sympathize with this sentiment, but how different are drawdown risks? And if we’re in a new regime, what do we do about it?
Are Drawdowns More Frequent?
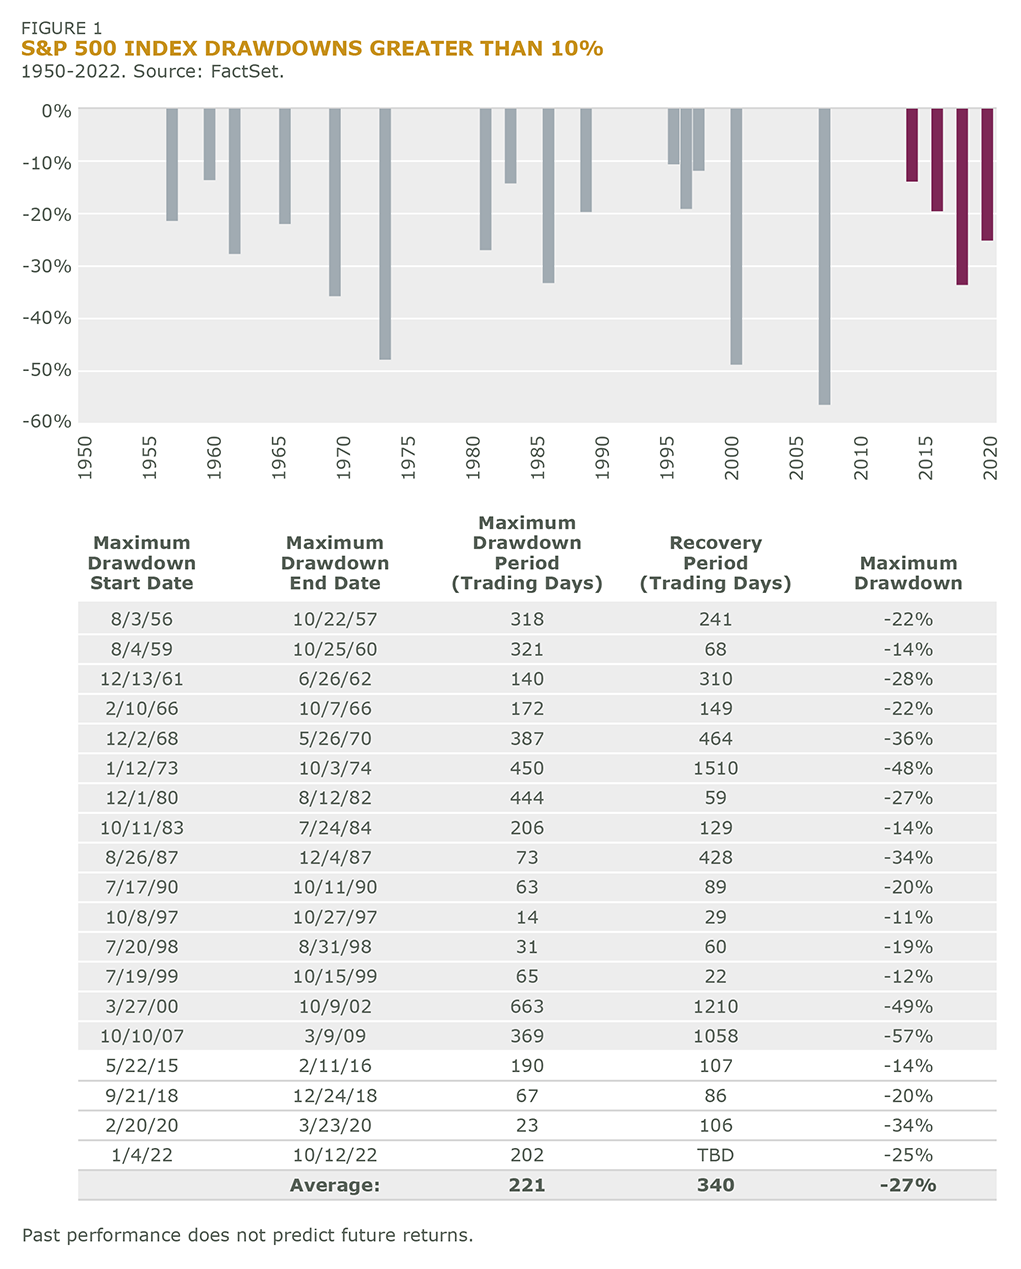
Using the S&P 500 as a proxy for equities here due to its long history, since the turn of the century we’ve seen both the two most severe drawdowns since 1950 (the tech bubble of 2000 and global financial crisis of 2008), and three of greater than 20% in the last five years alone (see Figure 1). The catalysts of the latter – trade war concerns, Covid-19, and Russia’s invasion of Ukraine; an inflation hangover from three years of unprecedented stimulus; and subsequent monetary tightening and economic malaise – all might be considered exogenous shocks that investors largely did not see coming. Throw in another decline of more than 10% during the 2015-2016 sell-off and that’s four impactful drawdowns in less than two U.S. Presidential cycles. Compare that with 15 in the preceding 65 years, and they’ve been happening at more than double the rate (5 vs. 2.3 per decade).
Are Drawdowns More Dramatic?
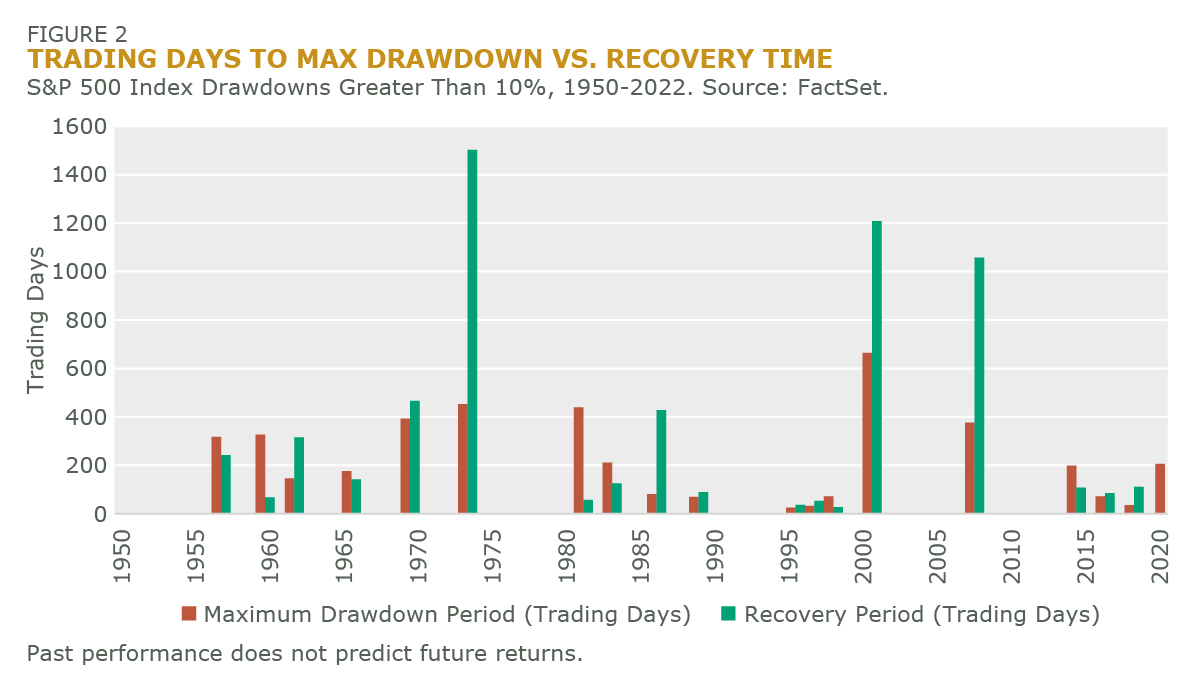
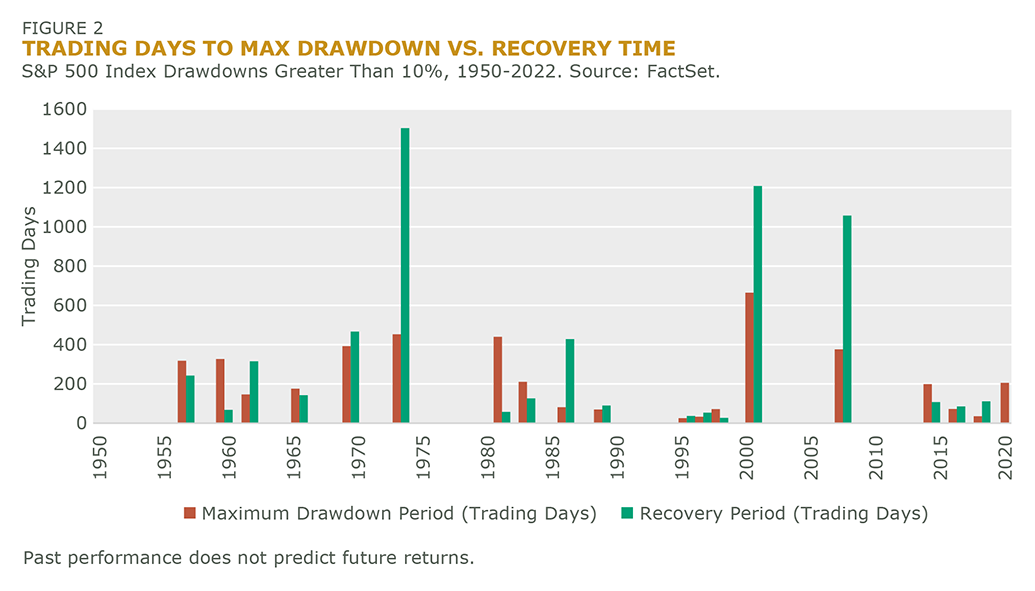
Like the new teenagers in my household, drawdowns have brought a lot of drama with them recently. Since 2015, the duration of the drawdown cycles – from peak to trough and back – has been relatively short (see Figure 2).
While you might assume that large market declines tend to reach their nadir more quickly when that trough isn’t as severe, you might actually be surprised. The recent drawdowns gave us steep declines, and their rebounds were steep too, hence their short durations. Figure 3 shows the relationship between the maximum drawdown and how long the market took to get there.
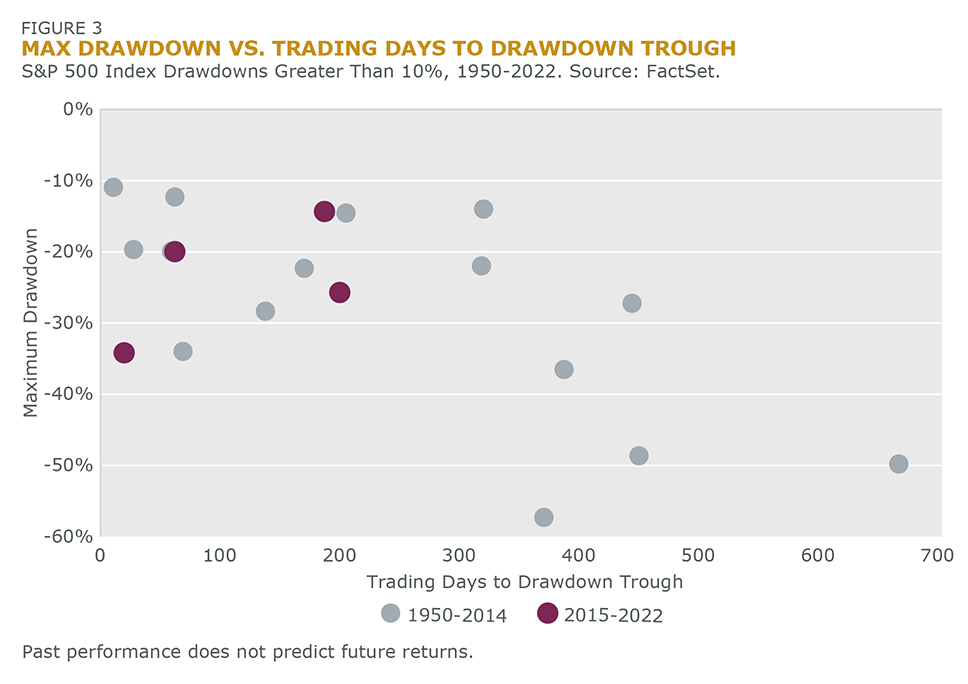
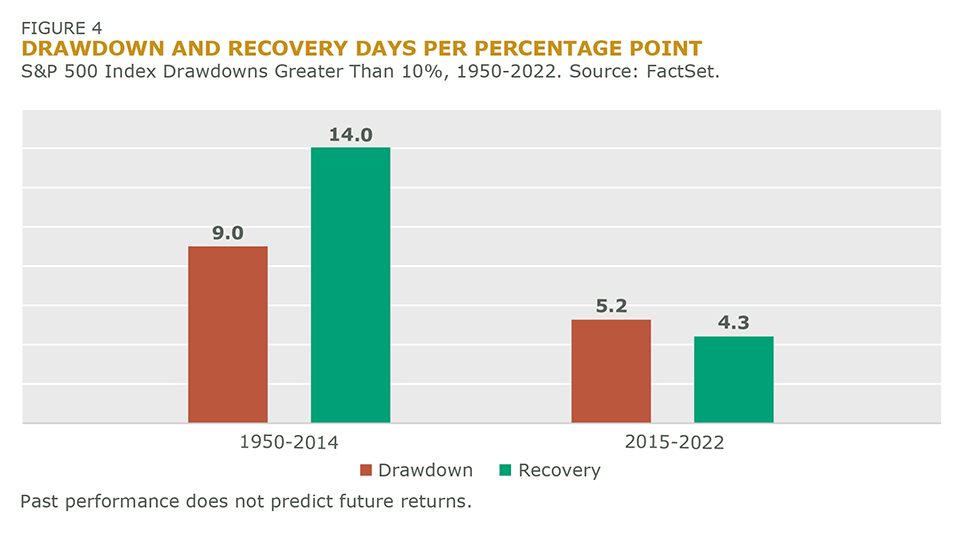
On average, since 2015 these drawdowns of more than 10% have taken about 5.2 days per percentage point of max drawdown, whereas those in the previous period (1950-2014) took roughly 9 days (Figure 4). The recoveries are bouncing back faster too: 4.3 days per percentage point vs. 14 days in the earlier period (not including the present yet-to-be-recovered decline that began 2022). Of course, we also saw sharp moves in the 1990s but these may be better characterized as very brief corrections in an otherwise predominant bull market.
As we mentioned earlier, the first-order causes of this recent set since 2015 have been primarily external factors, rather than structural issues within financial assets, e.g., the dot-com bubble bursting coinciding with a slowing economy, and the 2008 global financial crisis. Both declines in the early part of this century took much longer to play out as various dominos continued to fall, and commensurately markets took several years to return to their previous highs.
A more prolonged trundle downward allows more time for investors to adapt to a change in regimes and protect their capital. Even active defensive equity strategies may find it challenging to optimize fast enough to handle these rapid shifts in the market environment. Or they may become more defensively positioned near the bottom, only to be caught on the wrong side of the market just as the market rebounds to benefit higher-beta stocks (as it did out of the Covid crisis in 2020).
While the other more recent declines in 2018 and 2020 were substantial but short-lived – the latter almost shockingly so in the face of the worst pandemic in a century – historically, drawdowns that imperil investor outcomes come in all shapes and sizes. The expiration date for today’s equity market uncertainty is yet-to-be-determined, ranging from a deep, recession to the kind of soft landing that would make Captain “Sully” Sullenberger proud.
For all their critical utility to investors, public equities in the short- to medium-term may be at the mercy of geopolitical uncertainty, refreshed concerns about the fragility of our banking system, and a Fed that seems determined to crush inflation with elevated interest rates at nearly any cost. Or it may be some other, yet unknown risk, like many before.
Today’s Equity Strategies Need Convexity and More
Significant equity drawdowns like those we’ve outlined here, whether they’re short-lived or long-lasting, contribute a significant source of risk to most portfolios and the potential for a devastating loss of capital. The typical investor response is to 1) change capital market assumptions, 2) make tactical portfolio changes, or 3) make strategic portfolio changes. These responses come with their own baggage, of course. What’s more, they may do little to navigate drawdowns, as asset class correlations often break down when they’re needed most.
Making asset allocation adjustments for any reason is a complex, time-consuming process, requiring collaboration and communication across investment teams, consultants, and trustees. Making frequent allocation adjustments in the face of drawdowns is simply impractical. Yet, most investors require significant equity allocations, and traditional equity strategies are ill-suited for markets that swiftly change opposite of your expectations.
In response to today’s challenges, Intech has developed an innovative equity strategy that seeks to anticipate market dislocations to provide convexity in market tail events, alpha across market regimes, and help stabilize the portfolio diversification investors intend.
This strategy is engineered to target:
- Convexity in a market tail event
- Reduced systemic risk exposure
- Expected portfolio-level diversification
- Higher risk-adjusted returns
We are excited to share this solution. Designed for today’s evolving equity markets and beyond, the strategy seeks to consistently outperform the capitalization-weighted equity market with less volatility while boosting performance during extreme short-term market moves.
If you’re interested in hearing about it, please don’t hesitate to reach out for more information.

